This tutorial will show you how to identify drivers causing high Deferred Procedure Call (DPC) latencies. Spikes of high DPC latency can cause a computer to slow to a crawl for a few seconds before speeding up again in super-speed to catch up, then repeating a number of seconds later. During the few seconds of slowness (high latency spike), you may notice jerky and erratic mouse movement, poor quality, stuttering, audio, and pausing and skipping in real time video playback. If these symptoms sound familiar, read on.
The technique outlined below will work on Windows 7 and Windows 8. It will not work on Windows XP, but an alternative for Step II has been briefly outlined at the bottom of this tutorial for Windows Vista.
In addition, this technique is fairly technically advanced. Although it should be perfectly possible for anyone to complete provided you follow carefully the instructions given, if you require further clarification of any particular steps, or run into any sort of difficulties, please do not hesitate to ask us for help.
Step I (optional): Making a Quick Diagnosis:
[This part is not yet possible on Windows 8 computers. If you are using Windows 8, please skip ahead to Step II]
This step will allow you to quickly and easily determine whether or not high DPC latencies are indeed a problem on your computer. It is not necessary to perform this step, since it will not show you the cause of any DPC latency spikes it does find. Step II will be used to determine the cause any of such problems, and so you may wish to skip ahead to Step II now.
1. Download and run DPC Latency Checker from this website: DPC Latency Checker
2. Allow it to run until you have experienced a period of lagging and computer slowness. It is important to allow the program to run through such a time period in order to make a proper diagnosis. Having it running only whilst the computer is performing normally is not nearly as effective.
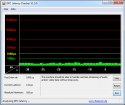
3. Analyze the graph for a large spike into the reds. A healthy graph will remain in the green section, and will look similar to this:
A graph containing spikes into the red (indicative of a DPC latency problem) will look similar to this:
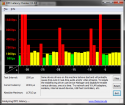
Now identify whether or not you have a DPC Latency problem using the graphs given above as a reference. If you do, continue on to Step II to identify the cause of this problem.
Step II (if necessary): Identifying the Cause:
[This technique is not possible on Windows Vista computers. If you are using Windows Vista, please skip ahead to the end of this step for a briefly outlined alternative.]
This step will use the Microsoft Windows Performance Analyzer from the Windows Assessment and Deployment Kit (ADK) to identify the cause of any DPC latency spikes.
1. Download the ADK from this website: Download Windows Assessment and Deployment Kit (ADK) for Windows® 8.1 from Official Microsoft Download Centre
Ignore the reference to Windows 8.1. This download applies to both Windows 7 and Windows 8.
2. Run ADKSetup.exe and allow it to initialize past the splash screen.
[The following screenshots may be expanded by clicking on them if registered]
Click Next:

Click Next again (you may opt in to CEIP if you so wish - it is not necessary, but you may wish to do so):

Click Accept:

Alter the checkmarks to be next to the following box only:
Windows Performance Toolkit
and click Install.

Allow the install to complete:

and finally click Close:

Part 2:
[Windows 7] Click on the Start Orb, search for cmd, and press Enter.
[Windows 8] Swipe up or right click on the Start Screen, select All Apps, swipe or scroll to the right, and under the Windows System section, open Command Prompt.
Now, in Command Prompt:
Type out the following line and press Enter:
xperf -on DiagEasy
Nothing much will appear to happen, but xperf is now logging. Wait until the computer has gone through a period of stuttering slowness, and then type out the next line and press Enter (this line may take several seconds to process):
xperf -d %userprofile%\Desktop\trace.etl
Finally type this line and press Enter:
xperf %userprofile%\Desktop\trace.etl
If you get prompted the following message, select Yes:
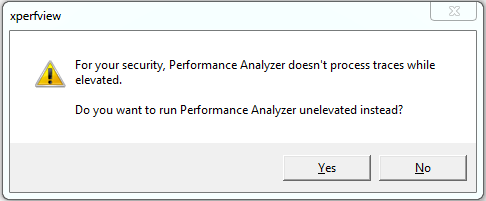
A new window will now open, and after initializing, will containing several graphs.
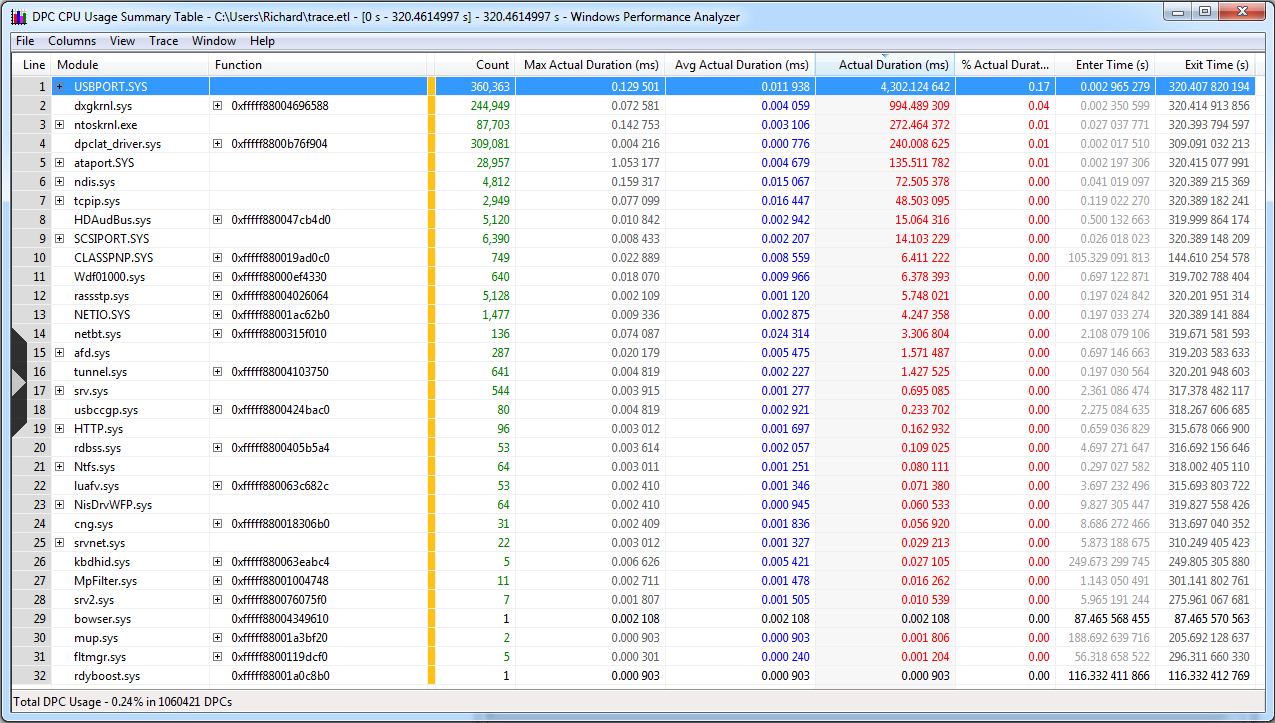
Scroll down to the graph titled DPC CPU usage, right click on it, and select Summary Table. The example graph show below comes from a healthy computer, yours is likely to show much larger spikes and a smaller scale on the % usage axis.
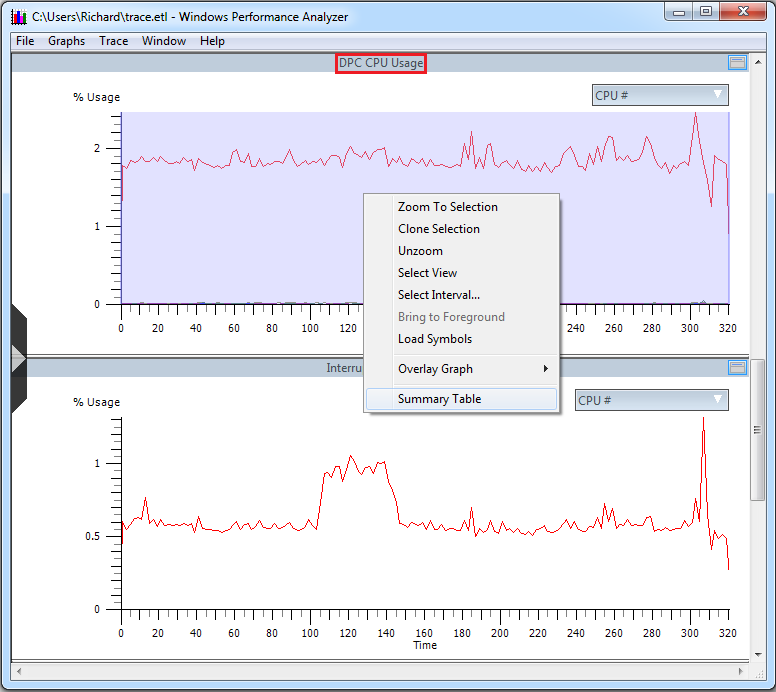
A final new window will open containing a list of drivers. This list is already correctly sorted (by the Actual Duration column). The driver on the very top of the list is therefore likely to be the cause of your problem. Note down its name from the leftmost column.
You may now close both Windows Performance Analyzer windows and go back to the Command Prompt.
Type the following line final line and press Enter:
del %userprofile%\Desktop\trace.etl
Now close the Command Prompt window.
Part 3:
Now you need to fix the problem. With the driver name in hand, first try to identify where it comes from. Our Driver Reference Table (located here: Driver Reference Table) will help you with this task. It is a large database of many common drivers, and it is likely that the driver you are searching for is there. If you are, however, unable to identify the driver there, please do not hesitate to ask us for help.
Once you have identified the driver, you need to update it from the manufacturer's website. The Driver Reference Table should point you to such a website for the drivers that are contained within it.
Just download and install the latest version of the driver, and hopefully your DPC related problems will be resolved.
However, if they are not resolved, you continue to have problems after updating the driver, or you continue to experience other problems, please do not hesitate to ask us for assistance, providing as much detail as is possible. You will be required to register with this forum before you are able to create a new thread (you can register here: Register at Sysnative Forums), but this process is quick and completely free.
Alternative Step II for Windows Vista
As an alternative to Step II for Windows Vista computers, you may use a program called LatencyMon which can be downloaded here: Resplendence Software - Free Downloads
Once installed, start LatencyMon from the Start Orb > All Programs > LatencyMon.
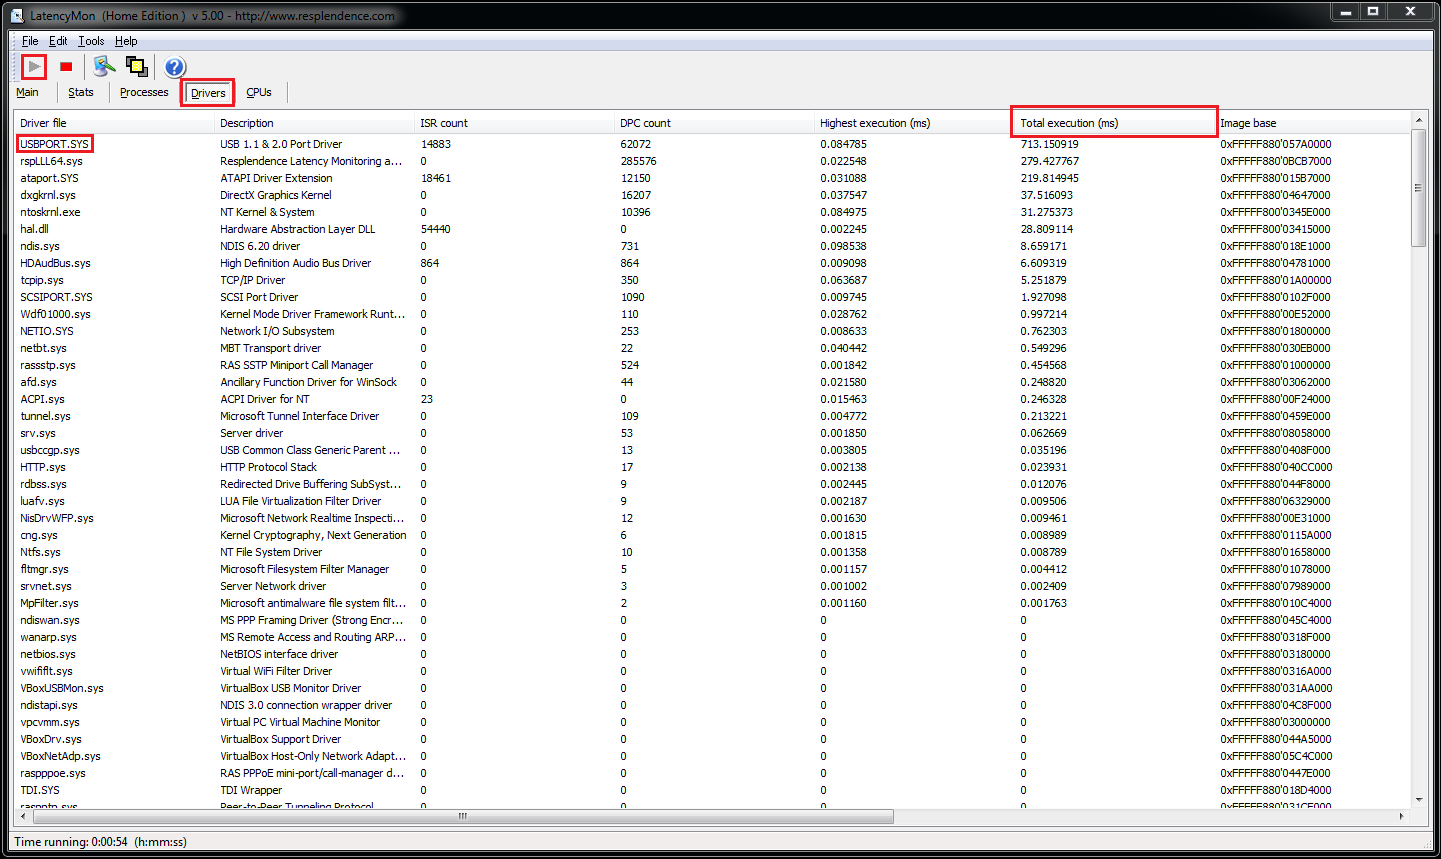
In the top left hand corner of the window which opens, click on the green start button (highlighted in the image below). Then navigate to the Drivers tab, sort by the Total Execution (ms) column, and wait until the computer has gone through one of its periods of lagging or stuttering. Finally, read off and note down the driver at the top of the list, and continue with Part 3 of Step II.
The technique outlined below will work on Windows 7 and Windows 8. It will not work on Windows XP, but an alternative for Step II has been briefly outlined at the bottom of this tutorial for Windows Vista.
In addition, this technique is fairly technically advanced. Although it should be perfectly possible for anyone to complete provided you follow carefully the instructions given, if you require further clarification of any particular steps, or run into any sort of difficulties, please do not hesitate to ask us for help.
Step I (optional): Making a Quick Diagnosis:
[This part is not yet possible on Windows 8 computers. If you are using Windows 8, please skip ahead to Step II]
This step will allow you to quickly and easily determine whether or not high DPC latencies are indeed a problem on your computer. It is not necessary to perform this step, since it will not show you the cause of any DPC latency spikes it does find. Step II will be used to determine the cause any of such problems, and so you may wish to skip ahead to Step II now.
1. Download and run DPC Latency Checker from this website: DPC Latency Checker
2. Allow it to run until you have experienced a period of lagging and computer slowness. It is important to allow the program to run through such a time period in order to make a proper diagnosis. Having it running only whilst the computer is performing normally is not nearly as effective.
3. Analyze the graph for a large spike into the reds. A healthy graph will remain in the green section, and will look similar to this:

A graph containing spikes into the red (indicative of a DPC latency problem) will look similar to this:

Now identify whether or not you have a DPC Latency problem using the graphs given above as a reference. If you do, continue on to Step II to identify the cause of this problem.
Step II (if necessary): Identifying the Cause:
[This technique is not possible on Windows Vista computers. If you are using Windows Vista, please skip ahead to the end of this step for a briefly outlined alternative.]
This step will use the Microsoft Windows Performance Analyzer from the Windows Assessment and Deployment Kit (ADK) to identify the cause of any DPC latency spikes.
1. Download the ADK from this website: Download Windows Assessment and Deployment Kit (ADK) for Windows® 8.1 from Official Microsoft Download Centre
Ignore the reference to Windows 8.1. This download applies to both Windows 7 and Windows 8.
2. Run ADKSetup.exe and allow it to initialize past the splash screen.
[The following screenshots may be expanded by clicking on them if registered]
Click Next:

Click Next again (you may opt in to CEIP if you so wish - it is not necessary, but you may wish to do so):

Click Accept:

Alter the checkmarks to be next to the following box only:
Windows Performance Toolkit
and click Install.

Allow the install to complete:

and finally click Close:

Part 2:
[Windows 7] Click on the Start Orb, search for cmd, and press Enter.
[Windows 8] Swipe up or right click on the Start Screen, select All Apps, swipe or scroll to the right, and under the Windows System section, open Command Prompt.
Now, in Command Prompt:
Type out the following line and press Enter:
xperf -on DiagEasy
Nothing much will appear to happen, but xperf is now logging. Wait until the computer has gone through a period of stuttering slowness, and then type out the next line and press Enter (this line may take several seconds to process):
xperf -d %userprofile%\Desktop\trace.etl
Finally type this line and press Enter:
xperf %userprofile%\Desktop\trace.etl
If you get prompted the following message, select Yes:
A new window will now open, and after initializing, will containing several graphs.
Scroll down to the graph titled DPC CPU usage, right click on it, and select Summary Table. The example graph show below comes from a healthy computer, yours is likely to show much larger spikes and a smaller scale on the % usage axis.
A final new window will open containing a list of drivers. This list is already correctly sorted (by the Actual Duration column). The driver on the very top of the list is therefore likely to be the cause of your problem. Note down its name from the leftmost column.
You may now close both Windows Performance Analyzer windows and go back to the Command Prompt.
Type the following line final line and press Enter:
del %userprofile%\Desktop\trace.etl
Now close the Command Prompt window.
Part 3:
Now you need to fix the problem. With the driver name in hand, first try to identify where it comes from. Our Driver Reference Table (located here: Driver Reference Table) will help you with this task. It is a large database of many common drivers, and it is likely that the driver you are searching for is there. If you are, however, unable to identify the driver there, please do not hesitate to ask us for help.
Once you have identified the driver, you need to update it from the manufacturer's website. The Driver Reference Table should point you to such a website for the drivers that are contained within it.
Just download and install the latest version of the driver, and hopefully your DPC related problems will be resolved.
However, if they are not resolved, you continue to have problems after updating the driver, or you continue to experience other problems, please do not hesitate to ask us for assistance, providing as much detail as is possible. You will be required to register with this forum before you are able to create a new thread (you can register here: Register at Sysnative Forums), but this process is quick and completely free.
Alternative Step II for Windows Vista
As an alternative to Step II for Windows Vista computers, you may use a program called LatencyMon which can be downloaded here: Resplendence Software - Free Downloads
Once installed, start LatencyMon from the Start Orb > All Programs > LatencyMon.
In the top left hand corner of the window which opens, click on the green start button (highlighted in the image below). Then navigate to the Drivers tab, sort by the Total Execution (ms) column, and wait until the computer has gone through one of its periods of lagging or stuttering. Finally, read off and note down the driver at the top of the list, and continue with Part 3 of Step II.
Last edited:
